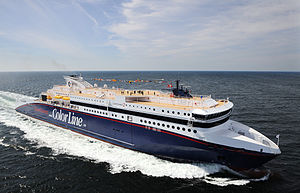
Superspeed 2

better than riding a car with a single passenger
(based on 2022 data)
Often travels on 0 routes
⚠️
Do you know of a route that this ship frequently travels but is not listed? Or have you noticed an error?
Please help by letting us know, thank you 🙇🏽♀️
Please help by letting us know, thank you 🙇🏽♀️
Ship Statistics
| 2022 yearly CO₂ Emissions | |||
|---|---|---|---|
| assigned to | total | average | ratio |
| persons 🙎♀️ | 17560 tonnes CO₂ | 288 g·CO₂/pax/n.mile | 22 % ⚙️ |
| freight 🚛 | 62256 tonnes CO₂ | 467 kg·CO₂/m tonne/n.mile | 78 % ⚙️ |
| total | 79816 tonnes CO₂ | 699 kg·CO₂/n.mile | 100% |
| 2022 yearly statistics | |
|---|---|
| distance travelled | 211328 km ⚙️ |
| time at sea | 4874 hours |
| 2022 average statistics per journey | |
|---|---|
| average persons transported 🙎♀️ | 535 persons ⚙️ |
| average freight transported 🚛 | 1168 metric tons ⚙️ |
| average speed | 43 km/h ⚙️ |
2022 monitoring methods:
N/A
2022 Theoretical
EIV (Efficiency Indicator Values): 21.07 gCO₂/ton/nautical mile
﹖ details
| 2021 yearly CO₂ Emissions | |||
|---|---|---|---|
| assigned to | total | average | ratio |
| persons 🙎♀️ | 56229 tonnes CO₂ | 653 g·CO₂/pax/n.mile | 70 % ⚙️ |
| freight 🚛 | 24444 tonnes CO₂ | 41 kg·CO₂/m tonne/n.mile | 30 % ⚙️ |
| total | 80674 tonnes CO₂ | 720 kg·CO₂/n.mile | 100% |
| 2021 yearly statistics | |
|---|---|
| distance travelled | 207470 km ⚙️ |
| time at sea | 4811 hours |
| 2021 average statistics per journey | |
|---|---|
| average persons transported 🙎♀️ | 769 persons ⚙️ |
| average freight transported 🚛 | 5368 metric tons ⚙️ |
| average speed | 43 km/h ⚙️ |
2021 monitoring methods:
N/A
2021 Theoretical
EIV (Efficiency Indicator Values): 21.07 gCO₂/ton/nautical mile
﹖ details
| 2020 yearly CO₂ Emissions | |||
|---|---|---|---|
| assigned to | total | average | ratio |
| persons 🙎♀️ | 61939 tonnes CO₂ | 2388 g·CO₂/pax/n.mile | 81 % ⚙️ |
| freight 🚛 | 14529 tonnes CO₂ | 95 kg·CO₂/m tonne/n.mile | 19 % ⚙️ |
| total | 76468 tonnes CO₂ | 711 kg·CO₂/n.mile | 100% |
| 2020 yearly statistics | |
|---|---|
| distance travelled | 199208 km ⚙️ |
| time at sea | 4588 hours |
| 2020 average statistics per journey | |
|---|---|
| average persons transported 🙎♀️ | 241 persons ⚙️ |
| average freight transported 🚛 | 1424 metric tons ⚙️ |
| average speed | 43 km/h ⚙️ |
2020 monitoring methods:
N/A
2020 Theoretical
EIV (Efficiency Indicator Values): 21.07 gCO₂/ton/nautical mile
﹖ details
| 2019 yearly CO₂ Emissions | |||
|---|---|---|---|
| assigned to | total | average | ratio |
| persons 🙎♀️ | 51723 tonnes CO₂ | 886 g·CO₂/pax/n.mile | 60 % ⚙️ |
| freight 🚛 | 34482 tonnes CO₂ | 226 kg·CO₂/m tonne/n.mile | 40 % ⚙️ |
| total | 86205 tonnes CO₂ | 752 kg·CO₂/n.mile | 100% |
| 2019 yearly statistics | |
|---|---|
| distance travelled | 212244 km ⚙️ |
| time at sea | 4953 hours |
| 2019 average statistics per journey | |
|---|---|
| average persons transported 🙎♀️ | 509 persons ⚙️ |
| average freight transported 🚛 | 1333 metric tons ⚙️ |
| average speed | 43 km/h ⚙️ |
2019 monitoring methods:
N/A
2019 Theoretical
EIV (Efficiency Indicator Values): 21.07 gCO₂/ton/nautical mile
﹖ details
| 2018 yearly CO₂ Emissions | |||
|---|---|---|---|
| assigned to | total | average | ratio |
| persons 🙎♀️ | 53134 tonnes CO₂ | 902 g·CO₂/pax/n.mile | 60 % ⚙️ |
| freight 🚛 | 35422 tonnes CO₂ | 215 kg·CO₂/m tonne/n.mile | 40 % ⚙️ |
| total | 88556 tonnes CO₂ | 750 kg·CO₂/n.mile | 100% |
| 2018 yearly statistics | |
|---|---|
| distance travelled | 218692 km ⚙️ |
| time at sea | 5209 hours |
| 2018 average statistics per journey | |
|---|---|
| average persons transported 🙎♀️ | 499 persons ⚙️ |
| average freight transported 🚛 | 1395 metric tons ⚙️ |
| average speed | 42 km/h ⚙️ |
2018 monitoring methods:
N/A
2018 Theoretical
EIV (Efficiency Indicator Values): 107 gCO₂/ton/nautical mile
﹖ details
ℹ️
Figures with the icon ⚙️ were computed based on the published data.
You can find computation details on
this page ↗
GreenFerries is a hobby project, all the data shown here has no official value. It is Open Source, so you can double check and modify it.

The Ecoscore compares
average CO₂ emissions per passenger per km.
‟emits like 2.1 planes” means that the ferry emits more than twice what an average plane would on the same distance for one passenger.