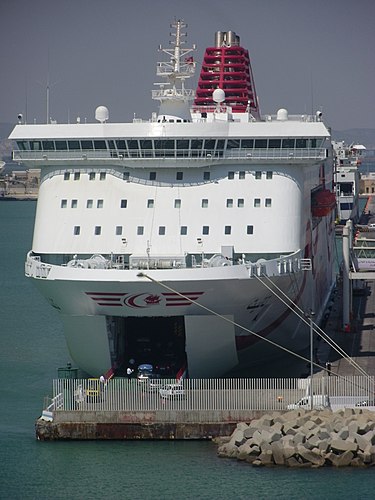
Tanit

2 to 4 times an average plane's emissions
(based on 2022 data)
Often travels on 0 routes
⚠️
Do you know of a route that this ship frequently travels but is not listed? Or have you noticed an error?
Please help by letting us know, thank you 🙇🏽♀️
Please help by letting us know, thank you 🙇🏽♀️
Ship Statistics
| 2022 yearly CO₂ Emissions | |||
|---|---|---|---|
| assigned to | total | average | ratio |
| persons 🙎♀️ | 68786 tonnes CO₂ | 948 g·CO₂/pax/n.mile | 97 % ⚙️ |
| freight 🚛 | 1455 tonnes CO₂ | 1083 kg·CO₂/m tonne/n.mile | 3 % ⚙️ |
| total | 70967 tonnes CO₂ | 1123 kg·CO₂/n.mile | 100% |
| 2022 yearly statistics | |
|---|---|
| distance travelled | 116994 km ⚙️ |
| time at sea | 2744 hours |
| 2022 average statistics per journey | |
|---|---|
| average persons transported 🙎♀️ | 1149 persons ⚙️ |
| average freight transported 🚛 | 21 metric tons ⚙️ |
| average speed | 43 km/h ⚙️ |
2022 monitoring methods:
N/A
2022 Theoretical
EIV (Efficiency Indicator Values): 2.85 gCO₂/ton/nautical mile
﹖ details
| 2021 yearly CO₂ Emissions | |||
|---|---|---|---|
| assigned to | total | average | ratio |
| persons 🙎♀️ | 52384 tonnes CO₂ | 894 g·CO₂/pax/n.mile | 87 % ⚙️ |
| freight 🚛 | 7018 tonnes CO₂ | 2189 kg·CO₂/m tonne/n.mile | 13 % ⚙️ |
| total | 60127 tonnes CO₂ | 1148 kg·CO₂/n.mile | 100% |
| 2021 yearly statistics | |
|---|---|
| distance travelled | 97035 km ⚙️ |
| time at sea | 2250 hours |
| 2021 average statistics per journey | |
|---|---|
| average persons transported 🙎♀️ | 1118 persons ⚙️ |
| average freight transported 🚛 | 61 metric tons ⚙️ |
| average speed | 43 km/h ⚙️ |
2021 monitoring methods:
N/A
2021 Theoretical
EIV (Efficiency Indicator Values): 2.85 gCO₂/ton/nautical mile
﹖ details
| 2020 yearly CO₂ Emissions | |||
|---|---|---|---|
| assigned to | total | average | ratio |
| persons 🙎♀️ | 47479 tonnes CO₂ | 1632 g·CO₂/pax/n.mile | 95 % ⚙️ |
| freight 🚛 | 550 tonnes CO₂ | 370 kg·CO₂/m tonne/n.mile | 5 % ⚙️ |
| total | 49738 tonnes CO₂ | 1154 kg·CO₂/n.mile | 100% |
| 2020 yearly statistics | |
|---|---|
| distance travelled | 79821 km ⚙️ |
| time at sea | 1936 hours |
| 2020 average statistics per journey | |
|---|---|
| average persons transported 🙎♀️ | 675 persons ⚙️ |
| average freight transported 🚛 | 34 metric tons ⚙️ |
| average speed | 41 km/h ⚙️ |
2020 monitoring methods:
N/A
2020 Theoretical
EIV (Efficiency Indicator Values): 2.85 gCO₂/ton/nautical mile
﹖ details
| 2019 yearly CO₂ Emissions | |||
|---|---|---|---|
| assigned to | total | average | ratio |
| persons 🙎♀️ | 74311 tonnes CO₂ | 1059 g·CO₂/pax/n.mile | 94 % ⚙️ |
| freight 🚛 | 1644 tonnes CO₂ | 463 kg·CO₂/m tonne/n.mile | 6 % ⚙️ |
| total | 78711 tonnes CO₂ | 1168 kg·CO₂/n.mile | 100% |
| 2019 yearly statistics | |
|---|---|
| distance travelled | 124779 km ⚙️ |
| time at sea | 2990 hours |
| 2019 average statistics per journey | |
|---|---|
| average persons transported 🙎♀️ | 1041 persons ⚙️ |
| average freight transported 🚛 | 53 metric tons ⚙️ |
| average speed | 42 km/h ⚙️ |
2019 monitoring methods:
N/A
2019 Theoretical
EIV (Efficiency Indicator Values): 2.85 gCO₂/ton/nautical mile
﹖ details
| 2018 yearly CO₂ Emissions | |||
|---|---|---|---|
| assigned to | total | average | ratio |
| persons 🙎♀️ | 66178 tonnes CO₂ | 9747 g·CO₂/pax/n.mile | 96 % ⚙️ |
| freight 🚛 | 1603 tonnes CO₂ | 1173 kg·CO₂/m tonne/n.mile | 4 % ⚙️ |
| total | 68860 tonnes CO₂ | 1079 kg·CO₂/n.mile | 100% |
| 2018 yearly statistics | |
|---|---|
| distance travelled | 118143 km ⚙️ |
| time at sea | 2865 hours |
| 2018 average statistics per journey | |
|---|---|
| average persons transported 🙎♀️ | 106 persons ⚙️ |
| average freight transported 🚛 | 21 metric tons ⚙️ |
| average speed | 41 km/h ⚙️ |
2018 monitoring methods:
N/A
2018 Theoretical
EIV (Efficiency Indicator Values): 2.85 gCO₂/ton/nautical mile
﹖ details
ℹ️
Figures with the icon ⚙️ were computed based on the published data.
You can find computation details on
this page ↗
GreenFerries is a hobby project, all the data shown here has no official value. It is Open Source, so you can double check and modify it.

The Ecoscore compares
average CO₂ emissions per passenger per km.
‟emits like 2.1 planes” means that the ferry emits more than twice what an average plane would on the same distance for one passenger.