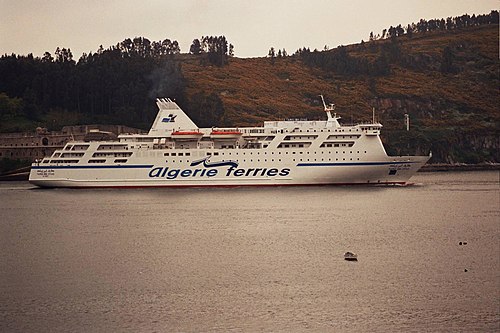
TARIQ IBN ZIYAD

better than riding a car with two passengers
(based on 2022 data)
Often travels on 0 routes
⚠️
Do you know of a route that this ship frequently travels but is not listed? Or have you noticed an error?
Please help by letting us know, thank you 🙇🏽♀️
Please help by letting us know, thank you 🙇🏽♀️
Ship Statistics
| 2022 yearly CO₂ Emissions | |||
|---|---|---|---|
| assigned to | total | average | ratio |
| persons 🙎♀️ | 878 tonnes CO₂ | 72 g·CO₂/pax/n.mile | 10 % ⚙️ |
| freight 🚛 | 7598 tonnes CO₂ | 914 kg·CO₂/m tonne/n.mile | 90 % ⚙️ |
| total | 8713 tonnes CO₂ | 653 kg·CO₂/n.mile | 100% |
| 2022 yearly statistics | |
|---|---|
| distance travelled | 24721 km ⚙️ |
| time at sea | 734 hours |
| 2022 average statistics per journey | |
|---|---|
| average persons transported 🙎♀️ | 913 persons ⚙️ |
| average freight transported 🚛 | 623 metric tons ⚙️ |
| average speed | 34 km/h ⚙️ |
2022 monitoring methods:
N/A
2022 Theoretical
EIV (Efficiency Indicator Values): 25.88 gCO₂/ton/nautical mile
﹖ details
| 2021 yearly CO₂ Emissions | |||
|---|---|---|---|
| assigned to | total | average | ratio |
| persons 🙎♀️ | 1 tonnes CO₂ | 413 g·CO₂/pax/n.mile | 0.015807327644803023 % ⚙️ |
| freight 🚛 | 5946 tonnes CO₂ | 1995 kg·CO₂/m tonne/n.mile | 100 % ⚙️ |
| total | 6326 tonnes CO₂ | 698 kg·CO₂/n.mile | 100% |
| 2021 yearly statistics | |
|---|---|
| distance travelled | 16784 km ⚙️ |
| time at sea | 299 hours |
| 2021 average statistics per journey | |
|---|---|
| average persons transported 🙎♀️ | 0.26747236782990136 persons ⚙️ |
| average freight transported 🚛 | 329 metric tons ⚙️ |
| average speed | 56 km/h ⚙️ |
2021 monitoring methods:
N/A
2021 Theoretical
EIV (Efficiency Indicator Values): 25.88 gCO₂/ton/nautical mile
﹖ details
| 2020 yearly CO₂ Emissions | |||
|---|---|---|---|
| assigned to | total | average | ratio |
| persons 🙎♀️ | N/A | N/A | N/A |
| freight 🚛 | N/A | N/A | N/A |
| total | N/A | N/A | 100% |
| 2020 yearly statistics | |
|---|---|
| distance travelled | N/A |
| time at sea | N/A |
| 2020 average statistics per journey | |
|---|---|
| average persons transported 🙎♀️ | N/A |
| average freight transported 🚛 | N/A |
| average speed | N/A |
2020 monitoring methods:
N/A
2020 Theoretical
N/A
﹖ details
| 2019 yearly CO₂ Emissions | |||
|---|---|---|---|
| assigned to | total | average | ratio |
| persons 🙎♀️ | 3074 tonnes CO₂ | 77 g·CO₂/pax/n.mile | 7 % ⚙️ |
| freight 🚛 | 39563 tonnes CO₂ | 318 kg·CO₂/m tonne/n.mile | 93 % ⚙️ |
| total | 43689 tonnes CO₂ | 632 kg·CO₂/n.mile | 100% |
| 2019 yearly statistics | |
|---|---|
| distance travelled | 128077 km ⚙️ |
| time at sea | 3639 hours |
| 2019 average statistics per journey | |
|---|---|
| average persons transported 🙎♀️ | 574 persons ⚙️ |
| average freight transported 🚛 | 1798 metric tons ⚙️ |
| average speed | 35 km/h ⚙️ |
2019 monitoring methods:
N/A
2019 Theoretical
EIV (Efficiency Indicator Values): 25.88 gCO₂/ton/nautical mile
﹖ details
| 2018 yearly CO₂ Emissions | |||
|---|---|---|---|
| assigned to | total | average | ratio |
| persons 🙎♀️ | 33030 tonnes CO₂ | 1209 g·CO₂/pax/n.mile | 97 % ⚙️ |
| freight 🚛 | N/A | N/A | 3 % ⚙️ |
| total | 33928 tonnes CO₂ | 702 kg·CO₂/n.mile | 100% |
| 2018 yearly statistics | |
|---|---|
| distance travelled | 89553 km ⚙️ |
| time at sea | 11124 hours |
| 2018 average statistics per journey | |
|---|---|
| average persons transported 🙎♀️ | 565 persons ⚙️ |
| average freight transported 🚛 | N/A |
| average speed | 8 km/h ⚙️ |
2018 monitoring methods:
N/A
2018 Theoretical
EIV (Efficiency Indicator Values): 25.88 gCO₂/ton/nautical mile
﹖ details
ℹ️
Figures with the icon ⚙️ were computed based on the published data.
You can find computation details on
this page ↗
GreenFerries is a hobby project, all the data shown here has no official value. It is Open Source, so you can double check and modify it.

The Ecoscore compares
average CO₂ emissions per passenger per km.
‟emits like 2.1 planes” means that the ferry emits more than twice what an average plane would on the same distance for one passenger.