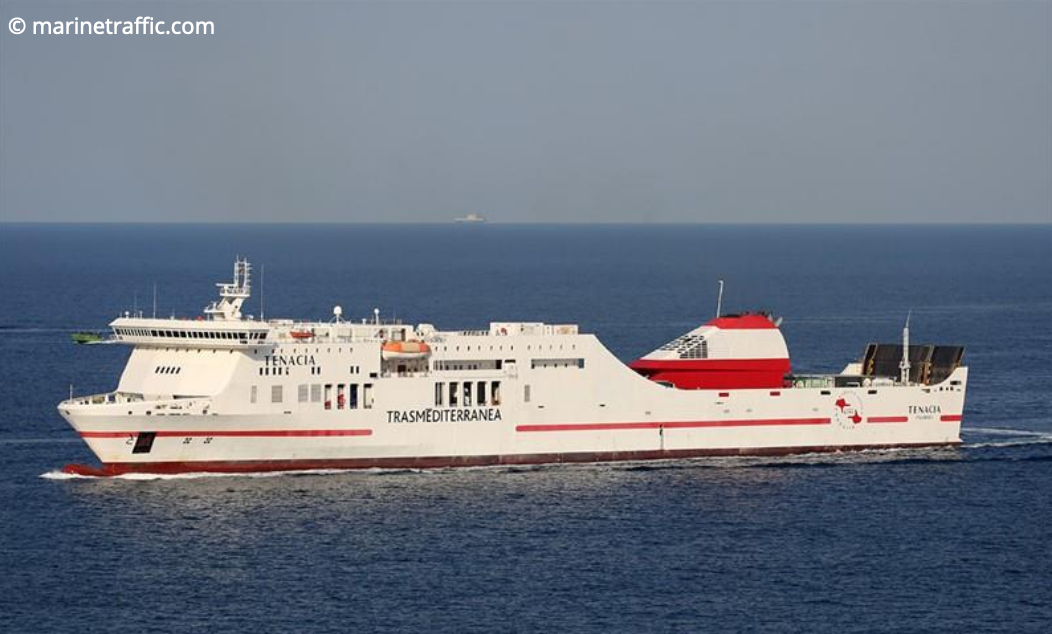
Tenacia

over 4 times an average plane's emissions
(based on 2022 data)
Often travels on 0 routes
⚠️
Do you know of a route that this ship frequently travels but is not listed? Or have you noticed an error?
Please help by letting us know, thank you 🙇🏽♀️
Please help by letting us know, thank you 🙇🏽♀️
Ship Statistics
| 2022 yearly CO₂ Emissions | |||
|---|---|---|---|
| assigned to | total | average | ratio |
| persons 🙎♀️ | 36804 tonnes CO₂ | 2688 g·CO₂/pax/n.mile | 80 % ⚙️ |
| freight 🚛 | 9201 tonnes CO₂ | 209 kg·CO₂/m tonne/n.mile | 20 % ⚙️ |
| total | 46005 tonnes CO₂ | 562 kg·CO₂/n.mile | 100% |
| 2022 yearly statistics | |
|---|---|
| distance travelled | 151727 km ⚙️ |
| time at sea | 4058 hours |
| 2022 average statistics per journey | |
|---|---|
| average persons transported 🙎♀️ | 167 persons ⚙️ |
| average freight transported 🚛 | 536 metric tons ⚙️ |
| average speed | 37 km/h ⚙️ |
2022 monitoring methods:
N/A
2022 Theoretical
EIV (Efficiency Indicator Values): 38.9 gCO₂/ton/nautical mile
﹖ details
| 2021 yearly CO₂ Emissions | |||
|---|---|---|---|
| assigned to | total | average | ratio |
| persons 🙎♀️ | 416 tonnes CO₂ | 24 g·CO₂/pax/n.mile | 0.7207287664793451 % ⚙️ |
| freight 🚛 | 57053 tonnes CO₂ | 211 kg·CO₂/m tonne/n.mile | 99 % ⚙️ |
| total | 57778 tonnes CO₂ | 523 kg·CO₂/n.mile | 100% |
| 2021 yearly statistics | |
|---|---|
| distance travelled | 204425 km ⚙️ |
| time at sea | 5343 hours |
| 2021 average statistics per journey | |
|---|---|
| average persons transported 🙎♀️ | 158 persons ⚙️ |
| average freight transported 🚛 | 2455 metric tons ⚙️ |
| average speed | 38 km/h ⚙️ |
2021 monitoring methods:
N/A
2021 Theoretical
EIV (Efficiency Indicator Values): 38.9 gCO₂/ton/nautical mile
﹖ details
| 2020 yearly CO₂ Emissions | |||
|---|---|---|---|
| assigned to | total | average | ratio |
| persons 🙎♀️ | 221 tonnes CO₂ | 17 g·CO₂/pax/n.mile | 0.5111957938638002 % ⚙️ |
| freight 🚛 | 42237 tonnes CO₂ | 164 kg·CO₂/m tonne/n.mile | 99 % ⚙️ |
| total | 43236 tonnes CO₂ | 491 kg·CO₂/n.mile | 100% |
| 2020 yearly statistics | |
|---|---|
| distance travelled | 163161 km ⚙️ |
| time at sea | 4632 hours |
| 2020 average statistics per journey | |
|---|---|
| average persons transported 🙎♀️ | 146 persons ⚙️ |
| average freight transported 🚛 | 2915 metric tons ⚙️ |
| average speed | 35 km/h ⚙️ |
2020 monitoring methods:
N/A
2020 Theoretical
EIV (Efficiency Indicator Values): 38.9 gCO₂/ton/nautical mile
﹖ details
| 2019 yearly CO₂ Emissions | |||
|---|---|---|---|
| assigned to | total | average | ratio |
| persons 🙎♀️ | 46036 tonnes CO₂ | 4 g·CO₂/pax/n.mile | 100 % ⚙️ |
| freight 🚛 | 46036 tonnes CO₂ | 0.29 kg·CO₂/m tonne/n.mile | N/A |
| total | 46036 tonnes CO₂ | 518 kg·CO₂/n.mile | 100% |
| 2019 yearly statistics | |
|---|---|
| distance travelled | 164704 km ⚙️ |
| time at sea | 4863 hours |
| 2019 average statistics per journey | |
|---|---|
| average persons transported 🙎♀️ | 132391 persons ⚙️ |
| average freight transported 🚛 | 1785000 metric tons ⚙️ |
| average speed | 34 km/h ⚙️ |
2019 monitoring methods:
N/A
2019 Theoretical
EIV (Efficiency Indicator Values): 38.9 gCO₂/ton/nautical mile
﹖ details
| 2018 yearly CO₂ Emissions | |||
|---|---|---|---|
| assigned to | total | average | ratio |
| persons 🙎♀️ | 38062 tonnes CO₂ | 4 g·CO₂/pax/n.mile | 99 % ⚙️ |
| freight 🚛 | 38062 tonnes CO₂ | 0.31 kg·CO₂/m tonne/n.mile | 0.5924155762751737 % ⚙️ |
| total | 38289 tonnes CO₂ | 490 kg·CO₂/n.mile | 100% |
| 2018 yearly statistics | |
|---|---|
| distance travelled | 144788 km ⚙️ |
| time at sea | 4411 hours |
| 2018 average statistics per journey | |
|---|---|
| average persons transported 🙎♀️ | 128121 persons ⚙️ |
| average freight transported 🚛 | 1570512 metric tons ⚙️ |
| average speed | 33 km/h ⚙️ |
2018 monitoring methods:
N/A
2018 Theoretical
EIV (Efficiency Indicator Values): 38.9 gCO₂/ton/nautical mile
﹖ details
ℹ️
Figures with the icon ⚙️ were computed based on the published data.
You can find computation details on
this page ↗
GreenFerries is a hobby project, all the data shown here has no official value. It is Open Source, so you can double check and modify it.

The Ecoscore compares
average CO₂ emissions per passenger per km.
‟emits like 2.1 planes” means that the ferry emits more than twice what an average plane would on the same distance for one passenger.