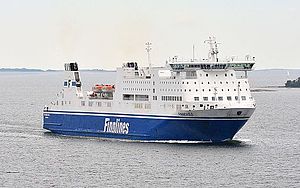
Vizzavona

better than riding a car with a single passenger
(based on 2022 data)
Often travels on 1 routes
- Marseille [FR] ↔ Bastia [FR] - 339 km
⚠️
Do you know of a route that this ship frequently travels but is not listed? Or have you noticed an error?
Please help by letting us know, thank you 🙇🏽♀️
Please help by letting us know, thank you 🙇🏽♀️
Ship Statistics
| 2022 yearly CO₂ Emissions | |||
|---|---|---|---|
| assigned to | total | average | ratio |
| persons 🙎♀️ | 6368 tonnes CO₂ | 299 g·CO₂/pax/n.mile | 17 % ⚙️ |
| freight 🚛 | 27756 tonnes CO₂ | 271 kg·CO₂/m tonne/n.mile | 83 % ⚙️ |
| total | 37560 tonnes CO₂ | 506 kg·CO₂/n.mile | 100% |
| 2022 yearly statistics | |
|---|---|
| distance travelled | 137570 km ⚙️ |
| time at sea | 4477 hours |
| 2022 average statistics per journey | |
|---|---|
| average persons transported 🙎♀️ | 287 persons ⚙️ |
| average freight transported 🚛 | 1378 metric tons ⚙️ |
| average speed | 31 km/h ⚙️ |
2022 monitoring methods:
N/A
2022 Theoretical
EIV (Efficiency Indicator Values): 25.64 gCO₂/ton/nautical mile
﹖ details
| 2021 yearly CO₂ Emissions | |||
|---|---|---|---|
| assigned to | total | average | ratio |
| persons 🙎♀️ | 5462 tonnes CO₂ | 297 g·CO₂/pax/n.mile | 16 % ⚙️ |
| freight 🚛 | 26093 tonnes CO₂ | 283 kg·CO₂/m tonne/n.mile | 84 % ⚙️ |
| total | 34730 tonnes CO₂ | 532 kg·CO₂/n.mile | 100% |
| 2021 yearly statistics | |
|---|---|
| distance travelled | 120803 km ⚙️ |
| time at sea | 3814 hours |
| 2021 average statistics per journey | |
|---|---|
| average persons transported 🙎♀️ | 282 persons ⚙️ |
| average freight transported 🚛 | 1413 metric tons ⚙️ |
| average speed | 32 km/h ⚙️ |
2021 monitoring methods:
N/A
2021 Theoretical
EIV (Efficiency Indicator Values): 25.64 gCO₂/ton/nautical mile
﹖ details
| 2020 yearly CO₂ Emissions | |||
|---|---|---|---|
| assigned to | total | average | ratio |
| persons 🙎♀️ | 4751 tonnes CO₂ | 400 g·CO₂/pax/n.mile | 16 % ⚙️ |
| freight 🚛 | 21825 tonnes CO₂ | 317 kg·CO₂/m tonne/n.mile | 84 % ⚙️ |
| total | 30019 tonnes CO₂ | 525 kg·CO₂/n.mile | 100% |
| 2020 yearly statistics | |
|---|---|
| distance travelled | 105852 km ⚙️ |
| time at sea | 3789 hours |
| 2020 average statistics per journey | |
|---|---|
| average persons transported 🙎♀️ | 208 persons ⚙️ |
| average freight transported 🚛 | 1205 metric tons ⚙️ |
| average speed | 28 km/h ⚙️ |
2020 monitoring methods:
N/A
2020 Theoretical
EIV (Efficiency Indicator Values): 11.38 gCO₂/ton/nautical mile
﹖ details
| 2019 yearly CO₂ Emissions | |||
|---|---|---|---|
| assigned to | total | average | ratio |
| persons 🙎♀️ | 33001 tonnes CO₂ | 991 g·CO₂/pax/n.mile | 70 % ⚙️ |
| freight 🚛 | 11372 tonnes CO₂ | 197 kg·CO₂/m tonne/n.mile | 30 % ⚙️ |
| total | 47061 tonnes CO₂ | 538 kg·CO₂/n.mile | 100% |
| 2019 yearly statistics | |
|---|---|
| distance travelled | 162081 km ⚙️ |
| time at sea | 4966 hours |
| 2019 average statistics per journey | |
|---|---|
| average persons transported 🙎♀️ | 380 persons ⚙️ |
| average freight transported 🚛 | 660 metric tons ⚙️ |
| average speed | 33 km/h ⚙️ |
2019 monitoring methods:
N/A
2019 Theoretical
EIV (Efficiency Indicator Values): 11.38 gCO₂/ton/nautical mile
﹖ details
| 2018 yearly CO₂ Emissions | |||
|---|---|---|---|
| assigned to | total | average | ratio |
| persons 🙎♀️ | 4779 tonnes CO₂ | 229 g·CO₂/pax/n.mile | 11 % ⚙️ |
| freight 🚛 | 32838 tonnes CO₂ | 441 kg·CO₂/m tonne/n.mile | 89 % ⚙️ |
| total | 41791 tonnes CO₂ | 544 kg·CO₂/n.mile | 100% |
| 2018 yearly statistics | |
|---|---|
| distance travelled | 142310 km ⚙️ |
| time at sea | 4455 hours |
| 2018 average statistics per journey | |
|---|---|
| average persons transported 🙎♀️ | 272 persons ⚙️ |
| average freight transported 🚛 | 968 metric tons ⚙️ |
| average speed | 32 km/h ⚙️ |
2018 monitoring methods:
N/A
2018 Theoretical
EIV (Efficiency Indicator Values): 11.38 gCO₂/ton/nautical mile
﹖ details
ℹ️
Figures with the icon ⚙️ were computed based on the published data.
You can find computation details on
this page ↗
GreenFerries is a hobby project, all the data shown here has no official value. It is Open Source, so you can double check and modify it.

The Ecoscore compares
average CO₂ emissions per passenger per km.
‟emits like 2.1 planes” means that the ferry emits more than twice what an average plane would on the same distance for one passenger.