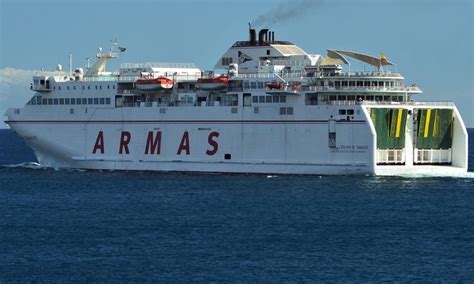
Volcan De Tamasite

2 to 4 times an average plane's emissions
(based on 2022 data)
Often travels on 0 routes
⚠️
Do you know of a route that this ship frequently travels but is not listed? Or have you noticed an error?
Please help by letting us know, thank you 🙇🏽♀️
Please help by letting us know, thank you 🙇🏽♀️
Ship Statistics
| 2022 yearly CO₂ Emissions | |||
|---|---|---|---|
| assigned to | total | average | ratio |
| persons 🙎♀️ | 8703 tonnes CO₂ | 1052 g·CO₂/pax/n.mile | 42 % ⚙️ |
| freight 🚛 | 10703 tonnes CO₂ | 918 kg·CO₂/m tonne/n.mile | 58 % ⚙️ |
| total | 20629 tonnes CO₂ | 490 kg·CO₂/n.mile | 100% |
| 2022 yearly statistics | |
|---|---|
| distance travelled | 77991 km ⚙️ |
| time at sea | 2911 hours |
| 2022 average statistics per journey | |
|---|---|
| average persons transported 🙎♀️ | 196 persons ⚙️ |
| average freight transported 🚛 | 277 metric tons ⚙️ |
| average speed | 27 km/h ⚙️ |
2022 monitoring methods:
N/A
2022 Theoretical
EIV (Efficiency Indicator Values): 21.63 gCO₂/ton/nautical mile
﹖ details
| 2021 yearly CO₂ Emissions | |||
|---|---|---|---|
| assigned to | total | average | ratio |
| persons 🙎♀️ | 10532 tonnes CO₂ | 1412 g·CO₂/pax/n.mile | 49 % ⚙️ |
| freight 🚛 | 10049 tonnes CO₂ | 824 kg·CO₂/m tonne/n.mile | 51 % ⚙️ |
| total | 21414 tonnes CO₂ | 538 kg·CO₂/n.mile | 100% |
| 2021 yearly statistics | |
|---|---|
| distance travelled | 73658 km ⚙️ |
| time at sea | 2242 hours |
| 2021 average statistics per journey | |
|---|---|
| average persons transported 🙎♀️ | 187 persons ⚙️ |
| average freight transported 🚛 | 307 metric tons ⚙️ |
| average speed | 33 km/h ⚙️ |
2021 monitoring methods:
N/A
2021 Theoretical
EIV (Efficiency Indicator Values): 21.63 gCO₂/ton/nautical mile
﹖ details
| 2020 yearly CO₂ Emissions | |||
|---|---|---|---|
| assigned to | total | average | ratio |
| persons 🙎♀️ | 8513 tonnes CO₂ | 1465 g·CO₂/pax/n.mile | 38 % ⚙️ |
| freight 🚛 | 13424 tonnes CO₂ | 834 kg·CO₂/m tonne/n.mile | 62 % ⚙️ |
| total | 22279 tonnes CO₂ | 511 kg·CO₂/n.mile | 100% |
| 2020 yearly statistics | |
|---|---|
| distance travelled | 80730 km ⚙️ |
| time at sea | 2421 hours |
| 2020 average statistics per journey | |
|---|---|
| average persons transported 🙎♀️ | 133 persons ⚙️ |
| average freight transported 🚛 | 369 metric tons ⚙️ |
| average speed | 33 km/h ⚙️ |
2020 monitoring methods:
N/A
2020 Theoretical
EIV (Efficiency Indicator Values): 21.63 gCO₂/ton/nautical mile
﹖ details
| 2019 yearly CO₂ Emissions | |||
|---|---|---|---|
| assigned to | total | average | ratio |
| persons 🙎♀️ | 9260 tonnes CO₂ | 921 g·CO₂/pax/n.mile | 33 % ⚙️ |
| freight 🚛 | 18937 tonnes CO₂ | 921 kg·CO₂/m tonne/n.mile | 67 % ⚙️ |
| total | 28196 tonnes CO₂ | 502 kg·CO₂/n.mile | 100% |
| 2019 yearly statistics | |
|---|---|
| distance travelled | 103978 km ⚙️ |
| time at sea | 3132 hours |
| 2019 average statistics per journey | |
|---|---|
| average persons transported 🙎♀️ | 179 persons ⚙️ |
| average freight transported 🚛 | 366 metric tons ⚙️ |
| average speed | 33 km/h ⚙️ |
2019 monitoring methods:
N/A
2019 Theoretical
EIV (Efficiency Indicator Values): 21.63 gCO₂/ton/nautical mile
﹖ details
| 2018 yearly CO₂ Emissions | |||
|---|---|---|---|
| assigned to | total | average | ratio |
| persons 🙎♀️ | 27542 tonnes CO₂ | 3284 g·CO₂/pax/n.mile | 100 % ⚙️ |
| freight 🚛 | 27542 tonnes CO₂ | 2574 kg·CO₂/m tonne/n.mile | N/A |
| total | 27542 tonnes CO₂ | 452 kg·CO₂/n.mile | 100% |
| 2018 yearly statistics | |
|---|---|
| distance travelled | 112948 km ⚙️ |
| time at sea | 3471 hours |
| 2018 average statistics per journey | |
|---|---|
| average persons transported 🙎♀️ | 138 persons ⚙️ |
| average freight transported 🚛 | 175 metric tons ⚙️ |
| average speed | 33 km/h ⚙️ |
2018 monitoring methods:
N/A
2018 Theoretical
EIV (Efficiency Indicator Values): 21.63 gCO₂/ton/nautical mile
﹖ details
ℹ️
Figures with the icon ⚙️ were computed based on the published data.
You can find computation details on
this page ↗
GreenFerries is a hobby project, all the data shown here has no official value. It is Open Source, so you can double check and modify it.

The Ecoscore compares
average CO₂ emissions per passenger per km.
‟emits like 2.1 planes” means that the ferry emits more than twice what an average plane would on the same distance for one passenger.