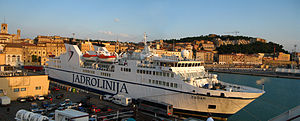
Zadar

better than riding a car with two passengers
(based on 2022 data)
Often travels on 1 routes
- Zadar [HR] ↔ Ancona [IT] - 151 km
⚠️
Do you know of a route that this ship frequently travels but is not listed? Or have you noticed an error?
Please help by letting us know, thank you 🙇🏽♀️
Please help by letting us know, thank you 🙇🏽♀️
Ship Statistics
| 2022 yearly CO₂ Emissions | |||
|---|---|---|---|
| assigned to | total | average | ratio |
| persons 🙎♀️ | 322 tonnes CO₂ | 0.02 g·CO₂/pax/n.mile | 3 % ⚙️ |
| freight 🚛 | 9328 tonnes CO₂ | 0.23 kg·CO₂/m tonne/n.mile | 97 % ⚙️ |
| total | 9650 tonnes CO₂ | 264 kg·CO₂/n.mile | 100% |
| 2022 yearly statistics | |
|---|---|
| distance travelled | 67692 km ⚙️ |
| time at sea | 3017 hours |
| 2022 average statistics per journey | |
|---|---|
| average persons transported 🙎♀️ | 440497 persons ⚙️ |
| average freight transported 🚛 | 1109609 metric tons ⚙️ |
| average speed | 22 km/h ⚙️ |
2022 monitoring methods:
N/A
2022 Theoretical
EIV (Efficiency Indicator Values): 23 gCO₂/ton/nautical mile
﹖ details
| 2021 yearly CO₂ Emissions | |||
|---|---|---|---|
| assigned to | total | average | ratio |
| persons 🙎♀️ | 8969 tonnes CO₂ | 0.57 g·CO₂/pax/n.mile | 80 % ⚙️ |
| freight 🚛 | 8969 tonnes CO₂ | 0.17 kg·CO₂/m tonne/n.mile | 20 % ⚙️ |
| total | 11211 tonnes CO₂ | 255 kg·CO₂/n.mile | 100% |
| 2021 yearly statistics | |
|---|---|
| distance travelled | 81465 km ⚙️ |
| time at sea | 3318 hours |
| 2021 average statistics per journey | |
|---|---|
| average persons transported 🙎♀️ | 357699 persons ⚙️ |
| average freight transported 🚛 | 1199343 metric tons ⚙️ |
| average speed | 25 km/h ⚙️ |
2021 monitoring methods:
N/A
2021 Theoretical
EIV (Efficiency Indicator Values): 23 gCO₂/ton/nautical mile
﹖ details
| 2020 yearly CO₂ Emissions | |||
|---|---|---|---|
| assigned to | total | average | ratio |
| persons 🙎♀️ | 8400 tonnes CO₂ | 0.84 g·CO₂/pax/n.mile | 79 % ⚙️ |
| freight 🚛 | 8400 tonnes CO₂ | 0.25 kg·CO₂/m tonne/n.mile | 21 % ⚙️ |
| total | 10622 tonnes CO₂ | 287 kg·CO₂/n.mile | 100% |
| 2020 yearly statistics | |
|---|---|
| distance travelled | 68639 km ⚙️ |
| time at sea | 3081 hours |
| 2020 average statistics per journey | |
|---|---|
| average persons transported 🙎♀️ | 269819 persons ⚙️ |
| average freight transported 🚛 | 906592 metric tons ⚙️ |
| average speed | 22 km/h ⚙️ |
2020 monitoring methods:
N/A
2020 Theoretical
EIV (Efficiency Indicator Values): 23 gCO₂/ton/nautical mile
﹖ details
| 2019 yearly CO₂ Emissions | |||
|---|---|---|---|
| assigned to | total | average | ratio |
| persons 🙎♀️ | 8698 tonnes CO₂ | 1 g·CO₂/pax/n.mile | 100 % ⚙️ |
| freight 🚛 | 8698 tonnes CO₂ | 0.51 kg·CO₂/m tonne/n.mile | -0.00011496975145242061 % ⚙️ |
| total | 8698 tonnes CO₂ | 279 kg·CO₂/n.mile | 100% |
| 2019 yearly statistics | |
|---|---|
| distance travelled | 57675 km ⚙️ |
| time at sea | 2490 hours |
| 2019 average statistics per journey | |
|---|---|
| average persons transported 🙎♀️ | 195315 persons ⚙️ |
| average freight transported 🚛 | 547648 metric tons ⚙️ |
| average speed | 23 km/h ⚙️ |
2019 monitoring methods:
N/A
2019 Theoretical
EIV (Efficiency Indicator Values): 23 gCO₂/ton/nautical mile
﹖ details
| 2018 yearly CO₂ Emissions | |||
|---|---|---|---|
| assigned to | total | average | ratio |
| persons 🙎♀️ | 8816 tonnes CO₂ | 1 g·CO₂/pax/n.mile | 100 % ⚙️ |
| freight 🚛 | 8816 tonnes CO₂ | 0.42 kg·CO₂/m tonne/n.mile | N/A |
| total | 8816 tonnes CO₂ | 262 kg·CO₂/n.mile | 100% |
| 2018 yearly statistics | |
|---|---|
| distance travelled | 62405 km ⚙️ |
| time at sea | 2778 hours |
| 2018 average statistics per journey | |
|---|---|
| average persons transported 🙎♀️ | 221720 persons ⚙️ |
| average freight transported 🚛 | 622929 metric tons ⚙️ |
| average speed | 22 km/h ⚙️ |
2018 monitoring methods:
N/A
2018 Theoretical
EIV (Efficiency Indicator Values): 23 gCO₂/ton/nautical mile
﹖ details
ℹ️
Figures with the icon ⚙️ were computed based on the published data.
You can find computation details on
this page ↗
GreenFerries is a hobby project, all the data shown here has no official value. It is Open Source, so you can double check and modify it.

The Ecoscore compares
average CO₂ emissions per passenger per km.
‟emits like 2.1 planes” means that the ferry emits more than twice what an average plane would on the same distance for one passenger.